
A hydropower company posts a record annual profit. The quarterly report gets shared in every Telegram group, the EPS looks healthy, and the stock jumps. Six months later the board announces that the “dividend” will be paid in bonus shares, and a few months after that it files for a rights issue. Shareholders are confused. The company made money, didn’t it?
It booked money. That is not the same thing. Profit is an accounting opinion about what a company earned. Cash is a fact about what actually landed in its bank account. The cash flow statement NEPSE investors almost never open is where those two stories either agree or quietly fall apart. This piece shows you how to read it, what is specific about Nepali banks, hydropower and other listed firms, and why we think it is the single most underused document in a NEPSE annual report.
Our position is simple. Profit can be shaped by accrual choices, provisioning timing and regulatory allowances. Cash is much harder to fake. If you only check one thing beyond EPS, check whether the cash showed up.
Why profit and cash are not the same number

Nepali listed companies prepare accounts on an accrual basis under Nepal Financial Reporting Standards (NFRS), which are built on international standards and issued by the Accounting Standards Board (ASB) Nepal. Accrual accounting records income when it is earned, not when it is paid. A hydropower company that delivers electricity in Ashadh records revenue in Ashadh, even if the buyer pays in Bhadra. A bank records interest on a loan as income as it accrues, even if the borrower has not paid that month’s installment.
That is a sensible rule. It also opens a gap. Between “earned” and “received” sit receivables, unpaid interest, inventory, prepaid expenses and every other timing difference a business can carry. A company can show rising profit while its cash position deteriorates, simply because more and more of that profit is sitting in IOUs.
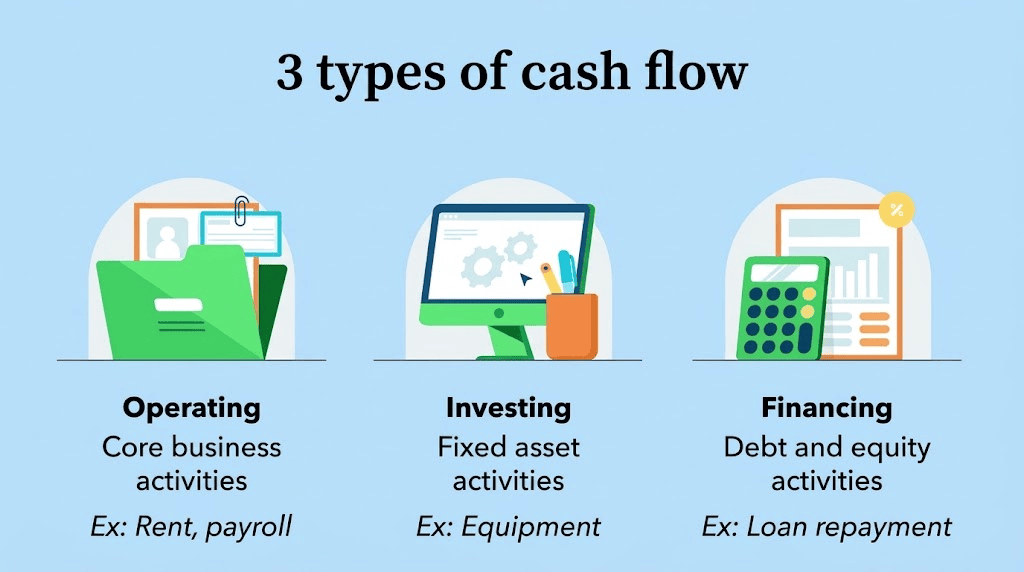
The cash flow statement closes the gap. ASB Nepal lists NAS 7, Statement of Cash Flows, among the standards that apply, and it requires companies to show where cash came from and where it went in three buckets:
- Operating activities: cash generated by the actual business (customers paying, suppliers and staff being paid, tax paid).
- Investing activities: cash spent on or received from long-term assets and investments (a new plant, a transmission line, government bonds bought or sold).
- Financing activities: cash raised from or returned to owners and lenders (rights shares, debentures, loans taken and repaid, dividends paid).
Add the three together and you get the change in cash for the year. Unlike net profit, that last line has no opinion in it.
The document most NEPSE investors never see
Here is a detail that explains a lot about retail behavior on NEPSE. Nepal Rastra Bank’s format for interim financial statements of “A”, “B” and “C” class institutions (the Banks and Financial Institution Regulation Department’s format issued in February 2019) separates two versions of the quarterly report. The version published in newspapers contains a condensed statement of financial position, a condensed profit or loss statement, comprehensive income and a short table of NRB ratios. The fuller version that banks upload to their own websites adds the condensed statement of cash flows, the statement of changes in equity and the notes.
In other words, the version most people glance at does not include cash flow at all. The newspaper extract, and the one-line summaries that circulate on trading sites, are built around profit and EPS. If you want the cash picture, you have to go to the company’s website and open the full interim report or the audited annual report. Few people do. That is exactly why it is worth doing.
For non-bank companies, the annual report is the reliable place to look. Quarterly disclosures from hydropower, manufacturing and hotel companies vary in detail, so the audited annual statement is where you should do this work.
How to read the operating section (and why banks are different)
Start with operating cash flow, because it answers the most important question: does the core business turn its profit into cash?
For a normal company, a hydropower producer, a cement maker, a hotel, the test is direct. Compare net cash from operating activities to net profit over several years. If operating cash flow runs close to or above profit over a three to five year stretch, profit is converting into cash. If profit keeps rising while operating cash flow stalls or turns negative, something is absorbing the cash. Usually it is receivables or inventory.
Banks need a different lens, and this is where many investors get it wrong in both directions.
In NRB’s interim cash flow format, a bank’s operating section starts with cash items you can actually read: interest received, fees and other income received, dividends received, interest paid, commission paid, cash paid to employees and other expenses paid. That produces a subtotal called “operating cash flows before changes in operating assets and liabilities.” Below it sit the changes in loans to customers, deposits from customers, placements with other institutions, balances due from and to NRB, and borrowings.
Those second-half lines are the bank’s raw material. When deposits grow faster than loans, operating cash flow balloons. When the bank lends aggressively, it can turn sharply negative. Neither tells you much about whether the bank is healthy. A negative operating cash flow at a bank in a strong lending year is normal. A huge positive figure in a year when credit demand collapsed is not a sign of strength.
So for banks, ignore the headline operating cash number and look at two things instead.
First, interest received versus interest income. The profit or loss statement shows interest income on an accrual basis. The cash flow statement shows interest received in cash. If interest income keeps climbing while interest received lags, more of the bank’s reported earnings are sitting as unpaid interest on its books. During periods of stress in loan repayment, that gap is one of the earliest signals you can find in public documents.
Second, the pre-working-capital subtotal versus profit. “Operating cash flows before changes in operating assets and liabilities” is the closest thing a bank’s statement has to cash earnings. Track it against net profit over several quarters.
The regulator already admits accrued profit is softer
You do not have to take our word that accrued income deserves skepticism. Nepal Rastra Bank’s own rules treat it that way.
The clearest example came on July 29, 2024. According to ShareSansar’s report of the directive, NRB allowed banks and financial institutions to count interest income accrued up to the end of Shrawan 2081 (mid-August 2024) as part of fiscal year 2080/81 profit, a year that had already ended in mid-July. But the same directive required banks to move the remaining amount, after income tax and staff bonus, from the accumulated profit of 2080/81 into the regulatory reserve. In plain terms: you may report it as profit, but you may not distribute it as dividend.
That pattern runs through Nepali bank accounts. Annual reports routinely include a statement of distributable profit in which accrued interest receivable is deducted as a regulatory adjustment, and added back when it is actually collected. The regulator is telling you, through the structure of the accounts, that profit and cash-backed profit are different numbers. We explain how that adjustment works in our piece on distributable profit versus net profit. The cash flow statement is where you can see the gap directly, instead of waiting for it to show up as a smaller dividend.
Hydropower: one buyer, and a lot of trust in receivables

Hydropower is the sector where the cash flow statement earns its keep on NEPSE.
Almost every listed hydropower company sells its electricity to one buyer, the Nepal Electricity Authority (NEA), under a power purchase agreement. Revenue is booked when energy is delivered. Cash arrives when NEA pays the invoice. Most of the time that works. But a single-buyer structure means every listed hydro company carries the same counterparty risk, and when NEA’s own liquidity tightens, the delay hits all of them at once. In 2020, as the pandemic hit, The Himalayan Times reported that NEA had warned independent power producers that payments on monthly invoices could be delayed under the force majeure clause of their agreements. Those delays would not have shown up in reported revenue. They would have shown up in receivables and in operating cash flow.
There is a second hydropower-specific trap. Developers often book revenue as energy is generated, but disputes over curtailment, spillage during the wet season and deemed generation (whether NEA owes payment when it cannot take available power) can leave amounts recognized and then contested. If you want to understand the commercial terms behind this, our explainer on how hydropower PPAs work in Nepal covers the contract side.
For a hydro stock, read three lines together: trade receivables on the balance sheet, net operating cash flow, and the investing section. A company still building a second project will show heavy investing outflows funded by loans or rights shares in the financing section. That is fine if it was disclosed and the first project’s operating cash covers its debt service. It is not fine if operating cash is weak and the company is quietly using new financing to keep dividends going.
A worked example: two companies, same profit
Here is a hypothetical comparison. The companies and figures are invented to show the mechanics, not drawn from any listed firm.
Two hydropower companies each report net profit of NPR 20 crore for the year.
Company A shows net cash from operating activities of NPR 24 crore. Depreciation (a non-cash expense) adds back about NPR 6 crore, and receivables from NEA rose by a modest NPR 2 crore. Investing outflows are NPR 3 crore for routine maintenance. Financing shows NPR 10 crore of loan principal repaid and NPR 8 crore of cash dividends paid. Free cash flow (operating cash flow minus capital spending) is NPR 21 crore, comfortably covering both debt repayment and the dividend.
Company B shows net cash from operating activities of NPR 7 crore. Its depreciation add-back is similar, but receivables jumped by NPR 17 crore and the company recorded income on disputed energy that has not been settled. Investing outflows are NPR 40 crore for a new project. Financing shows a NPR 35 crore new term loan and NPR 10 crore raised through a rights issue. It paid a small cash dividend and announced a bonus share issue.
Same EPS. Completely different companies. Company A earns cash and returns it. Company B earns accounting profit, funds its growth and its distributions with borrowed and newly raised money, and hands shareholders bonus shares that cost the company no cash at all. On a profit-only screen they look identical. On a cash screen, one is a business and the other is a financing exercise that depends on the next loan.
The bonus share tell

Bonus shares deserve a short detour because they are so common on NEPSE.
A bonus share issue capitalizes reserves into share capital. No cash leaves the company, and no value is created for the shareholder: the share price adjusts downward to reflect the larger number of shares, a mechanism we walk through in our bonus share price adjustment explainer. For banks, bonus issues have often been tied to meeting regulatory capital requirements, which is a legitimate reason.
But for a non-financial company, a persistent preference for bonus shares over cash dividends, combined with weak operating cash flow, is a pattern worth noticing. Our reading: when a company with “strong profits” keeps choosing the one form of distribution that requires no cash, the cash flow statement usually explains why.
A five-step routine for any NEPSE stock
You can do this in fifteen minutes with a company’s last three audited annual reports.
- Add up three years of operating cash flow and three years of net profit. For non-financial companies, compare the totals. Cumulative operating cash flow well below cumulative profit, without a clear one-off explanation, is a warning.
- Find the gap. If cash lags profit, look at the working capital lines in the operating section. Rising receivables, inventory or “other assets” are where the missing cash usually sits.
- Calculate rough free cash flow. Subtract purchases of property, plant and equipment in the investing section from operating cash flow. This is the cash genuinely available to repay debt and pay owners.
- Check who paid the dividend. Compare dividends paid in the financing section with free cash flow. If dividends regularly exceed free cash flow, they are being funded by borrowing, rights issues or a shrinking cash balance.
- For banks, swap the test. Compare interest received with interest income, and track the pre-working-capital operating subtotal against net profit. Read alongside capital adequacy and NPL ratios, which we cover in our guide to reading a bank’s quarterly report.
None of this needs a paid data service. It needs the PDF and a calculator.
What the cash flow statement will not tell you
Fairness requires the limits too.
A single year of weak operating cash flow is not damning. A hydropower company in its first full year of operation, a manufacturer stocking up ahead of a festival season, or an insurer whose claims spiked after a flood can all show temporary dips. That is why the routine above uses three years, not one.
Cash flow statements can also be flattered. Delaying payments to suppliers inflates operating cash flow for a period. Classifying an item as investing rather than operating can move numbers between buckets. Under NAS 7, banks and companies have some choice about where interest and dividends sit, and NRB’s own format lists interest received and dividends received in both the operating and investing sections as templates. Read the notes before comparing two companies line by line.
And for banks, as covered above, the headline operating number is mostly noise. Anyone telling you a bank is in trouble because its operating cash flow turned negative in a heavy lending year has misread the statement.
The verdict
Profit tells you what management says the company earned. The cash flow statement tells you whether the business can prove it. On NEPSE, where retail attention runs almost entirely on EPS, dividend announcements and quarterly profit headlines, the investor who opens the cash flow section is reading a document most of the market ignores. NRB does not even require it in the newspaper version of a bank’s quarterly report.
Our view is that this is the most practical edge available to an ordinary Nepali investor. You do not need inside information. You need the full report from the company’s website and the habit of asking one question every time profit rises: did the cash come with it? When the answer is yes, year after year, you have found a business. When the answer keeps being “not yet,” you have found a story, and on NEPSE stories are usually priced long before they are paid.
This is analysis, not financial advice.
Frequently Asked Questions (FAQs)
1. What is a cash flow statement, and why is it important for NEPSE investors?
A cash flow statement shows how cash enters and leaves a company through operating, investing and financing activities. It helps investors check whether reported profits are backed by actual cash.
2. What is the difference between net profit and operating cash flow?
Net profit records income and expenses under accounting rules, even when cash has not been received or paid. Operating cash flow shows the actual cash generated or used by the company’s main business activities.
3. Why can a company report high profits but have low cash flow?
Cash may be tied up in unpaid customer bills, inventory or other expenses. This means the company can report a profit without receiving the equivalent amount in cash.
4. How should investors analyse a bank’s cash flow statement?
Investors should compare interest received with reported interest income and track operating cash flow before changes in operating assets and liabilities. A bank’s overall operating cash flow can be negative during a period of strong lending, so it should not be judged in isolation.
5. What does negative operating cash flow mean for a NEPSE-listed company?
Negative operating cash flow means the company’s operations used more cash than they generated during the period. One weak year does not automatically indicate a problem, but persistent negative cash flow alongside rising profits deserves closer investigation.