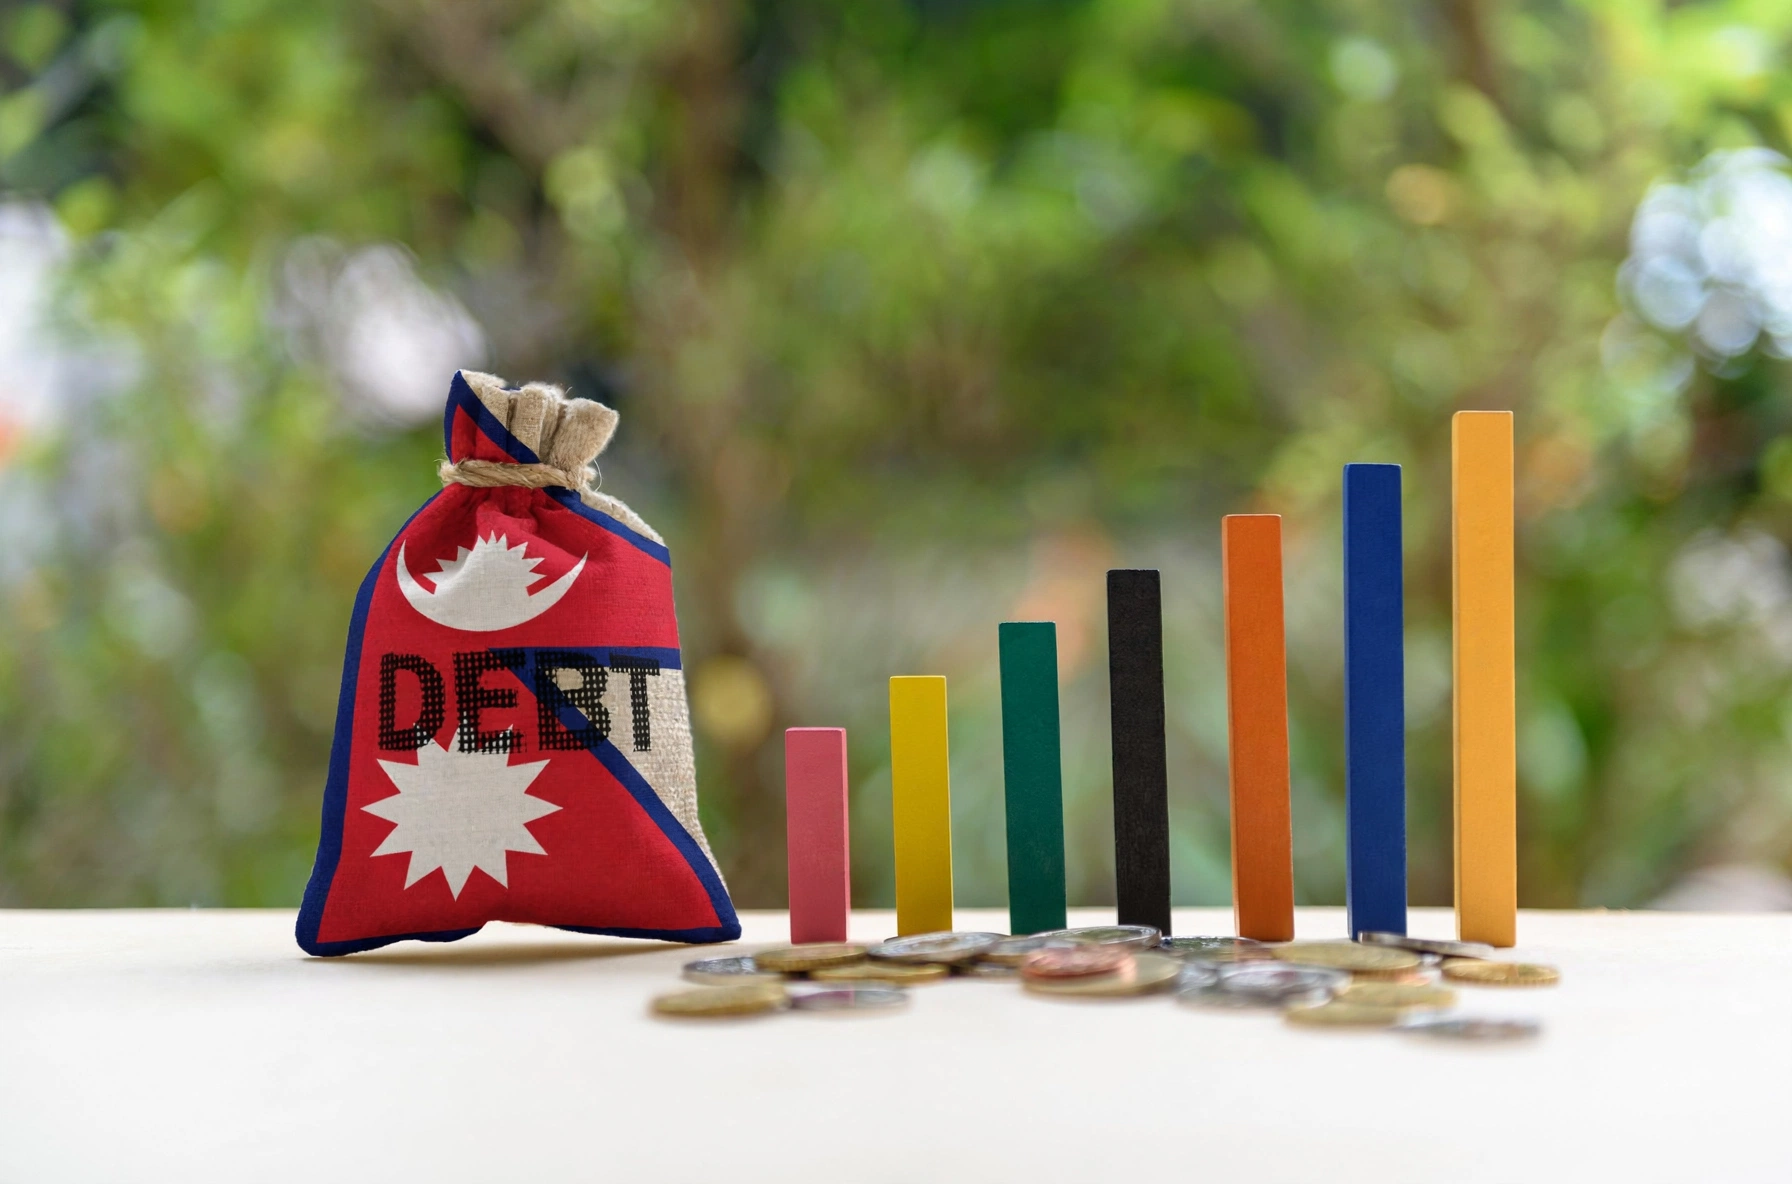
Nepal’s government keeps borrowing more, year after year. That’s not new. What’s new is the pace.
The Nepal public debt to GDP ratio has climbed sharply since 2020. It’s now approaching half the size of the entire national economy. This isn’t just a budget detail. It’s a long-term structural trend worth tracking closely.
As borrowing accelerates, so does the burden of repaying it. Debt servicing costs are eating into revenue that could otherwise fund schools, roads, and hospitals. Understanding this trajectory matters, both for policymakers and everyday citizens.
In this article, we’ll walk through the latest verified figures, explain what’s driving the increase, and explore why debt-servicing-to-revenue ratios deserve just as much attention as the headline debt number.
What the Nepal Public Debt to GDP Ratio Actually Measures
Before diving into numbers, let’s clarify what this ratio means.
The debt-to-GDP ratio compares a country’s total outstanding debt to the size of its overall economy. Essentially, it answers one question. How large is the debt burden, relative to what the country actually produces each year?
A rising ratio doesn’t automatically spell crisis. However, it does signal growing financial pressure, especially when revenue growth can’t keep pace with borrowing. That’s precisely the pattern Nepal is now experiencing.
The Numbers: A Rapid Climb Since 2020
Let’s start with the long-term trajectory, because the scale of change is striking.
According to reporting from Nepal News, Nepal’s total public debt stood at just Rs 1.433 trillion in fiscal year 2019/20. That represented 38.05% of GDP at the time. Since then, the debt burden has nearly doubled.
By the end of fiscal year 2024/25, in mid-July 2025, public debt had climbed to Rs 2.674 trillion, according to the Public Debt Management Office (PDMO). That put the debt-to-GDP ratio at 43.71%.
The climb continued through fiscal year 2025/26. By mid-November 2025, debt reached Rs 2,729.42 billion, pushing the ratio to 44.69%, according to the Annapurna Express. Just three months later, myRepublica reported the figure had risen further, to Rs 2.858 trillion, or 46.81% of GDP, by mid-February 2026.
The trend didn’t slow. Rising Nepal Daily reported debt reaching Rs 2,878.29 billion by mid-March 2026, a ratio of 47.13%. Then, by mid-April 2026, Nepal News reported the figure had climbed to Rs 2.934 trillion, equivalent to 48.04% of GDP, nearing the symbolic halfway mark.
Why Is Nepal’s Debt Rising So Fast?
Several forces are driving this rapid escalation, and they’re compounding each other.
First, revenue collection has weakened significantly. According to NEPSE Trading’s analysis of Nepal Rastra Bank data, government revenue fell by 5.3% even as expenditure rose by 31%. That combination alone widens the fiscal gap considerably.
Second, currency depreciation is inflating the cost of external debt. According to myRepublica, the Nepali rupee depreciated from Rs 137.35 per US dollar in mid-July 2025 to Rs 145.03 by mid-February 2026. Since much of Nepal’s external debt is denominated in US dollars or IMF Special Drawing Rights, this depreciation directly increases the local-currency value of foreign obligations.
By mid-March 2026, the exchange rate had weakened further still, reaching Rs 150.67 per dollar, the weakest level in Nepal’s currency history, according to Rising Nepal Daily. This alone added an estimated Rs 98 billion in extra loan burden within just eight months.
Third, new borrowing continues regardless of these pressures. Nepal News reported that fresh borrowing totaled Rs 348.15 billion during the first nine months of fiscal year 2025/26 alone, even as the government made principal repayments on existing loans.
The Debt Servicing Squeeze
Here’s where the trajectory becomes genuinely concerning. It’s not just about how much Nepal owes. It’s about how much it costs to service that debt each year.
According to CEO Tab’s June 2026 reporting, the government allocated Rs 411.1 billion for principal and interest payments in fiscal year 2025/26. By mid-June, Rs 351.74 billion, or 85.58% of that allocation, had already been spent. Altogether, debt servicing alone now amounts to 5.33% of Nepal’s GDP.
To put that in perspective, consider Nepal’s revenue base. According to NEPSE Trading, Nepal’s revenue-to-GDP ratio stands at just 19.6%, notably lower than pre-pandemic levels. When debt servicing consumes 5.33% of GDP against a revenue base of only 19.6% of GDP, that means roughly one out of every four rupees collected in revenue goes directly toward debt repayment.
This dynamic is squeezing other priorities. According to the World Bank’s April 2026 Nepal Development Update, capital expenditure has lagged behind debt servicing since the first half of fiscal year 2021/22. That gap widened to 2.2% of GDP in the first half of fiscal year 2025/26 alone, driven primarily by domestic debt amortization.
Where the Debt Comes From
Understanding the composition of Nepal’s debt also matters, since domestic and external borrowing carry different risks.
As of mid-April 2026, domestic debt stood at Rs 1.388 trillion, while external debt reached Rs 1.546 trillion, according to Nepal News. That splits roughly to external debt making up around 53% of the total, with domestic debt comprising the remaining 47%.
This mix matters because external debt is more exposed to currency risk, as we’ve already seen. Domestic debt, by contrast, carries refinancing risk instead. According to Nepal’s Ministry of Finance Public Debt Management Office, roughly 22.5% of total debt matures within a single year, creating moderate rollover pressure, particularly around T-bill maturities.
On the positive side, most of Nepal’s debt sits on relatively favorable terms. The Ministry of Finance reports a weighted average interest rate of just 3.4%, with 99.5% of debt carrying fixed interest rates. This limits exposure to sudden interest rate spikes, at least for now.
Is Nepal Headed Toward a Debt Trap?
This is the question economists are increasingly asking.
According to Nepal News, some economists warn that without shifting borrowed funds toward genuinely productive investments, Nepal risks entering a prolonged debt trap. A debt trap occurs when a country borrows primarily to repay old loans, rather than to finance investments that generate future income.
However, not every assessment is alarmed. The World Bank’s April 2026 Nepal Development Update projects public debt rising from 43.8% of GDP in fiscal year 2025 to 45.5% in fiscal year 2026, before gradually declining in fiscal years 2027 and 2028. Crucially, the report concludes this trajectory keeps Nepal at “low risk of debt distress,” at least under current projections.
Similarly, NEPSE Trading’s analysis notes that Nepal’s debt sustainability indicators remain favorable overall. Low inflation, currently at 1.87%, combined with record foreign exchange reserves of Rs 2.88 trillion, or roughly USD 20.41 billion, reduce near-term repayment risks.
Nonetheless, these favorable conditions depend heavily on continued fiscal discipline. If revenue collection keeps underperforming while expenditure keeps rising, the more optimistic projections could quickly prove too rosy.
Why This Metric Deserves Long-Term Tracking
So why should Nepal’s debt-to-GDP ratio and debt-servicing-to-revenue ratio be tracked as core structural metrics, rather than one-off headlines?
First, these ratios reveal fiscal sustainability trends long before a crisis actually hits. A steadily rising debt-to-GDP ratio, paired with a shrinking revenue base, is a classic early warning signal.
Second, the debt-servicing-to-revenue ratio specifically shows how much fiscal flexibility the government actually has. When debt servicing consumes a growing share of revenue, less money remains available for education, healthcare, or infrastructure investment, exactly the kind of spending that could boost long-term economic growth.
Third, tracking this trend over multiple years, rather than isolated data points, helps distinguish temporary fluctuations from genuine structural deterioration. Currency depreciation, for instance, can cause short-term ratio spikes that don’t necessarily reflect underlying fiscal mismanagement.
Finally, this metric matters for Nepal’s borrowing costs going forward. Credit rating agencies and international lenders closely watch these ratios when determining loan terms. A deteriorating trajectory could eventually raise Nepal’s borrowing costs, creating a difficult feedback loop.
What Could Improve Nepal’s Debt Trajectory
Fortunately, several policy levers could help stabilize this trend before it worsens further.
First, strengthening domestic revenue collection remains essential. Nepal’s revenue-to-GDP ratio of 19.6% leaves considerable room for improvement, particularly through better tax compliance and a broader industrial base.
Second, prioritizing productive capital investment over recurrent expenditure would help. As the World Bank noted, capital spending has consistently lagged behind debt servicing in recent years. Reversing that pattern could improve long-term growth prospects, which in turn would make existing debt more manageable relative to a larger economy.
Third, careful management of external borrowing timing could reduce currency risk exposure. Given how heavily exchange rate depreciation has driven recent debt increases, better hedging strategies or increased reliance on concessional domestic financing could help.
Finally, transparent, consistent public reporting on both debt levels and debt servicing costs would help policymakers, investors, and citizens track progress accurately over time.
Conclusion
The Nepal public debt to GDP ratio has moved from 38.05% in fiscal year 2019/20 to nearly 48% by mid-2026. That’s a dramatic structural shift in just six years.
Behind this headline number lies an equally important story. Debt servicing now consumes 5.33% of GDP, against a revenue base of just 19.6%. Meanwhile, capital expenditure continues losing ground to repayment obligations, threatening the very investments that could help Nepal grow out of this burden.
Whether Nepal avoids a genuine debt trap will depend on sustained fiscal discipline, stronger revenue collection, and smarter allocation of borrowed funds. Tracking both the debt-to-GDP ratio and the debt-servicing-to-revenue ratio, consistently and transparently, remains essential to answering that question accurately in the years ahead.
FAQ: Nepal’s Public Debt Trajectory
What is Nepal’s current public debt to GDP ratio?
As of mid-April 2026, Nepal’s public debt to GDP ratio stood at 48.04%, according to the Public Debt Management Office.
How much has Nepal’s public debt grown since 2020?
Public debt nearly doubled, from Rs 1.433 trillion (38.05% of GDP) in fiscal year 2019/20 to over Rs 2.9 trillion by 2026.
Why is Nepal’s debt-to-GDP ratio rising so quickly?
Weak revenue growth, rising government expenditure, currency depreciation, and continued new borrowing are all driving the increase.
What percentage of Nepal’s GDP goes toward debt servicing?
Debt servicing consumed about 5.33% of GDP in fiscal year 2025/26, according to the Public Debt Management Office.
Is Nepal at risk of a debt trap?
Some economists warn of growing risk if borrowed funds aren’t used productively, though the World Bank currently rates Nepal at low risk of debt distress.
What could help improve Nepal’s debt trajectory?
Stronger revenue collection, prioritizing productive capital investment, and better management of currency risk could all help stabilize the trend.