Natural disasters strike every corner of our planet. They tear through cities, destroy habitats, and alter human lives forever. In fact, clear global patterns show that a natural disaster cause harm and damages every year across vulnerable communities.
Over the last decade, extreme events have become far more severe. Climate change, rapid urbanization, and high asset density drive financial losses higher every season. Data through 2026 confirms that these escalating trends show no signs of slowing down. Furthermore, human populations face recurring displacement and long-term socio-economic distress.
This comprehensive analysis explores the true scope of global disaster impacts. We analyze financial numbers, human costs, sector vulnerabilities, and future risk mitigation strategies.
1. Global Economic Impact Over the Last Decade and 2026
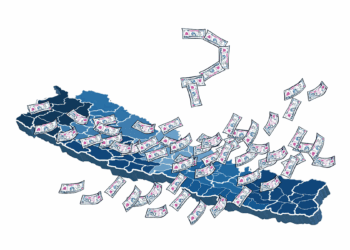
Financial records demonstrate a staggering trend in direct economic destruction. Over the past ten years, annual worldwide direct losses from natural catastrophes averaged between $250 billion and $350 billion USD. In major disaster years, combined damages pushed far past $350 billion.
10-Year Average Annual Losses: $250B - $350B USD
Peak Loss Years: Exceeding $350B USD
H1 2026 Losses: ~$100B - $112B USD
Insured Coverage Gap: ~60-65% Uninsured
Average Displaced People: 20M - 30M Annually
The Escalating Cost of Extreme Events
Direct damages include ruined buildings, broken utility grids, and wiped-out agricultural fields. Meanwhile, indirect costs include lost productivity and supply chain bottlenecks. Tropical cyclones alone generate average annual losses exceeding $100 billion.
- 2017: Record-breaking hurricane seasons (Harvey, Irma, Maria) pushed global losses past $300 billion.
- 2021: Severe floods in Western Europe and winter storms in North America raised financial losses significantly.
- 2023–2025: High-frequency secondary perils—such as severe convective storms, flash floods, and wildfires—drove total annual damages past standard historical baselines.
- 2026 Update: First-half estimates for 2026 show direct economic losses already reaching between $100 billion and $112 billion USD. Heavy convective storms in North America and spring flooding across Asia drove these mid-year numbers higher.
The Widening Insurance Protection Gap
Insurance plays a vital role in post-disaster recovery. However, less than 40% of global financial losses are covered by insurance providers. This structural shortfall leaves a multi-hundred-billion-dollar “protection gap” every single year.
In developing nations, under-insurance frequently exceeds 90%. As a result, governments must redirect funding away from healthcare, education, and social infrastructure toward disaster relief.
2. Human Cost: Fatalities, Displacement, and Health
While physical structures crumble, the human cost remains the most tragic aspect of natural disasters. Although modern early-warning systems save countless lives, severe casualties and permanent displacements remain widespread.
Direct vs. Indirect Fatalities
Annual direct fatalities from natural hazards generally range from 10,000 to 60,000 people globally. Yet, direct death tolls tell only part of the story.
Indirect deaths caused by waterborne disease outbreaks, destroyed hospital infrastructure, and prolonged heat exposure far outweigh immediate impact numbers. Extreme heat events during recent summer seasons caused thousands of uncounted premature deaths.
DISASTER IMPACT PIPELINE:
Hazard Strikes -> Primary Physical Damage -> Utility Interruption -> Water/Sanitation Failure -> Secondary Health Crisis
Mass Internal Displacement
Every year, 20 to 30 million people are forced to flee their homes due to weather hazards. Recent displacement numbers from 2025 and 2026 highlight the growing pressure on urban centers receiving displaced populations. Displaced communities face long-term economic instability, overcrowded shelters, and lost educational opportunities.
- Immediate Displacement: Evacuations during active typhoons, flash floods, or wildland fires.
- Permanent Relocation: Abandonment of coastal zones experiencing severe soil erosion and sea-level rise.
- Urban Migration: Rural farmers moving into overcrowded cities after repeated agricultural droughts.
3. Key Categories of Natural Hazards Analyzed
Disasters manifest in various physical forms, each presenting distinct systemic challenges. The last 10 years, including data from 2026, recorded shifts in both primary hazards and localized events.
| Disaster Type | Primary Physical Trigger | 10-Year Impact Trend | Major Geographic Risk Zones |
|---|---|---|---|
| Floods & Inundations | River overflow, extreme rain events | Highest frequency growth rate | South Asia, Western Europe, East Asia |
| Tropical Cyclones | High winds, ocean storm surge | Greater intensity, higher moisture content | Gulf of Mexico, Caribbean, East Asian Coastlines |
| Earthquakes & Tsunamis | Tectonic plate shifts | Sudden, catastrophic loss spikes | Pacific Ring of Fire, Himalayan Belt |
| Wildfires | Heatwaves, dry fuel accumulation | Longer seasons, expanding geographic scope | Western US, Mediterranean, Australia |
| Droughts | Extended precipitation deficits | Slow-onset, vast agricultural destruction | Horn of Africa, Central America, Southern Europe |
Water Hazards: Floods and Storm Surges
Flooding accounts for over 40% of all recorded disaster events in the past decade. Flash floods destroy rural roads, wash away topsoil, and breach urban drainage networks. Meanwhile, coastal storm surges flood densely populated ports and ruin saltwater estuaries.
Geopolitical and Seismic Disturbances
Earthquakes remain uniquely devastating because they strike without warning. Major earthquakes over the last decade demolished entire city centers in minutes. Early 2026 seismic activity in South America reminded planners that structural collapse risks remain severe without strict building enforcement.
4. Why Disaster Damage Costs Are Escalating
Understanding why financial costs continue rising requires analyzing socio-economic trends alongside environmental shifts. Three primary factors accelerate global disaster risks.
RISK MULTIPLIER MODEL:
Hazard Intensity + High Asset Density + Vulnerable Infrastructure = Massive Loss Escalation
Rapid Urbanization and Asset Concentration
More people live in vulnerable areas than ever before. Populated coastlines, river basins, and dry forest zones expand rapidly. When a severe storm strikes a coastal metropolis, losses multiply exponentially due to the high density of real estate, tech centers, and industrial facilities.
Aging Infrastructure and Structural Vulnerability
Much of the world’s core infrastructure was designed using historical weather data that no longer reflects modern climate realities. Power grids, bridges, municipal drainage systems, and seawalls routinely fail during extreme weather events.
Compound and Cascading Disasters
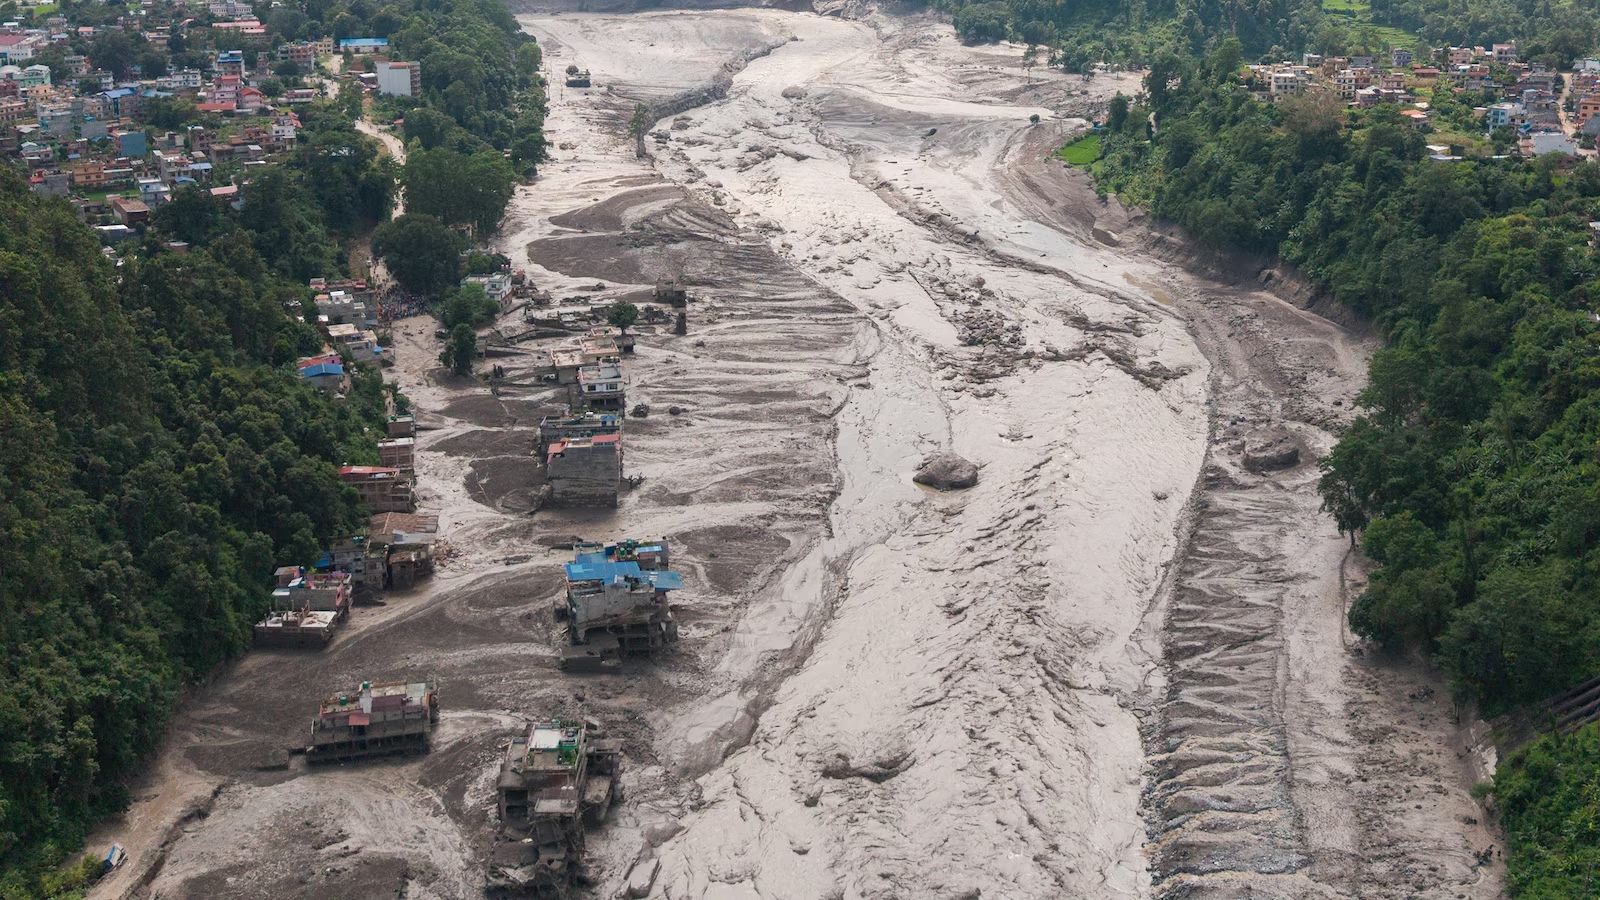
Single, isolated disasters are increasingly rare. Instead, communities now face compound events. For example, prolonged heatwaves dry out vegetation, sparking massive wildfires. Subsequently, heavy rains hit burnt hillsides, triggering massive mudslides and river blockages.
5. Sector-by-Sector Damage Breakdown
Disaster losses ripple across every sector of global commerce. Examining industry-specific vulnerabilities reveals systemic weaknesses in the global economy.
SECTORIAL IMPACT CASCADE:
1. Agriculture -> Crop Destruction -> Food Price Inflation
2. Infrastructure -> Power/Transport Outages -> Business Interruption
3. Real Estate -> Structural Ruin -> Insurance Insolvency & Risk Exclusion
Agriculture and Food Security
Extreme weather wreaks havoc on global food production. Droughts bake agricultural soil, while unseasonal floods wash away seeds before harvest. Smallholder farmers in low-income regions face catastrophic income loss, driving regional food insecurity higher.
Real Estate and Commercial Infrastructure
Physical real estate bears the largest share of direct asset damage. Residential housing developments built in floodplains or wildland zones face repeating destruction cycles. Over time, property values decline, leaving homeowners with unsellable assets.
Supply Chains and Manufacturing Logistics
Modern manufacturing relies on precise, just-in-time logistics networks. When extreme floods close major ocean ports, shut down railways, or inundate key microchip plants, global supply chains stall for months. These localized interruptions trigger global inflation and product shortages.
6. Developing vs. Developed Nations: A Disproportionate Burden
The economic and human consequences of extreme weather are distributed unevenly across the globe. High-income countries experience larger absolute dollar losses due to high asset values. Conversely, lower-income nations suffer far greater losses relative to their total gross domestic product (GDP).
DEVELOPED NATIONS: High Dollar Loss | High Insurance Coverage | Rapid Reconstruction
DEVELOPING NATIONS: High GDP Impact | Low Insurance Coverage | Long-Term Debt Spikes
- Fiscal Disruption: Low-income countries often spend large portions of their national budgets on emergency recovery.
- Reconstruction Delays: Poor infrastructure recovery can take a decade or longer, dragging down generational economic progress.
- Mortality Disparities: Fatality rates from equivalent natural disasters are up to four times higher in developing regions.
7. Solutions: Building Disaster Resilience for the Next Decade
Mitigating damages requires shifting from reactive disaster relief to proactive risk reduction. Investing early saves both money and lives.
RESILIENCE STRATEGY FRAMEWORK:
Pre-Disaster Investment -> Early Warning Systems -> Nature-Based Buffers -> Strict Building Codes
Proactive Investment in Early Warning Systems
Early warning technology offers some of the highest returns on investment available. Advanced satellite tracking, AI weather forecasting, and local emergency alert networks give communities time to evacuate safely, dramatically reducing fatalities.
Nature-Based Disaster Solutions
Natural ecosystems provide effective protection against extreme weather hazards. Replanting coastal mangrove forests buffers storm surges, while restoring wetlands absorbs excess floodwaters. Urban tree canopies cool cities during dangerous heatwaves.
Modernizing Building Codes and Land Zoning
Governments must enforce strict building standards that withstand local hazards. Ban residential development in vulnerable floodplains and high-risk fire zones. Upgrading bridges, retrofitting older structures, and reinforcing electrical grids reduces long-term physical damage.
Frequently Asked Questions
Why does a natural disaster cause harm and damages every year globally?
Natural disasters recur because of continuous environmental changes, high population density in coastal or river regions, and vulnerable infrastructure. As human settlements expand into high-risk natural zones, hazards cause severe physical and financial damage.
What was the average annual economic loss from natural disasters over the last 10 years?
Global direct economic losses averaged between $250 billion and $350 billion USD annually over the last decade. Extreme years featuring massive hurricane seasons or widespread flooding push total losses past $350 billion. Mid-year data for 2026 shows losses already reaching $100B to $112B USD.
Which natural disaster type causes the highest frequency of damage?
Flooding is the most frequent natural disaster worldwide, accounting for over 40% of recorded natural events over the last ten years. River overflows, flash floods, and coastal storm surges destroy property and infrastructure regularly.
What is the disaster protection gap in insurance?
The protection gap represents the difference between total economic losses and the proportion paid out by insurance companies. Less than 40% of global disaster losses are insured, leaving governments, businesses, and individuals to cover the remaining costs out-of-pocket.
Final Thoughts: Moving From Reaction to Resilience
The past decade proves that natural hazards will continue to test our global economy and social stability. Every single year, a natural disaster cause harm and damages across both developed and developing regions. However, catastrophic financial loss and loss of human life are not inevitable.
By shifting investments toward early warning networks, resilient infrastructure, nature-based defenses, and expanded insurance coverage, societies can reduce vulnerabilities. Protecting vulnerable communities today safeguards economic prosperity for the decade ahead.