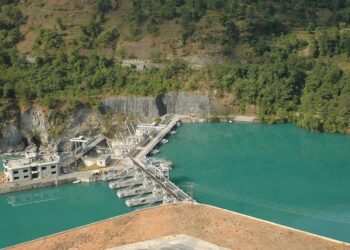
A promoter stands on stage at an IPO roadshow and says the words the room came to hear. “This is a 25 megawatt project.” Heads nod. Someone works out a rough dividend in their head. The subscription gets oversubscribed within hours. Almost nobody in that room asks the one question that decides whether the company will ever pay them: how many units of electricity will those 25 megawatts actually produce in a year? That gap, between the megawatt headline and the annual energy, is where the hydropower plant load factor Nepal investors keep ignoring does its quiet work. It is the number that turns a big, impressive plant into a thin, disappointing dividend, and it is missing from almost every sales pitch on purpose.
Installed capacity is marketing. Plant load factor is the earnings truth. If you learn to read only one metric on a hydropower prospectus, make it this one, because it is the difference between what a plant is rated to do and what the river will actually let it do.
This is a framework piece, not a stock tip. By the end you should be able to take any NEPSE hydropower company, find two numbers, and judge for yourself whether the megawatt figure everyone is quoting is honest or inflated.
What plant load factor actually measures
Plant load factor, often shortened to PLF and sometimes called the capacity factor, is a simple ratio. It is the electricity a plant actually generates in a year divided by the electricity it would have generated if it ran flat out at full nameplate capacity for every hour of that year. Nothing more complicated than that.
The arithmetic is worth doing once by hand, because it makes the whole problem visible. A 25 MW plant running at its full rating for all 8,760 hours in a year would produce 25,000 kilowatts times 8,760 hours, which is about 219 million kilowatt-hours, or 219 gigawatt-hours (GWh). That is the theoretical ceiling. No plant hits it. If that 25 MW plant actually generates 110 GWh across the year, its plant load factor is 110 divided by 219, or roughly 50%. Half. The other half of the nameplate is a number that exists on a brochure and nowhere else.
So when the promoter says “25 megawatts,” the honest translation is “25 megawatts for a few hours on a good monsoon day, and something far smaller for months at a stretch.” Revenue does not come from the nameplate. Revenue comes from units sold. Plant load factor is the bridge between the two, and if you do not cross that bridge, you are valuing a company on a number that never touches its bank account.
Why Nepal’s rivers make this worse than most
Most projects listed on NEPSE are run-of-river plants. A run-of-river plant has little or no reservoir, so it generates from whatever the river is carrying that day. It cannot store water for later. Its output follows the hydrology, and Nepal’s hydrology is brutally seasonal.
The monsoon fills the rivers from roughly June to September, and generation peaks. Then the dry season arrives, the snowmelt and rainfall both fall away, and river flows can drop to a fraction of their monsoon volume. Output collapses with them. The national numbers show the pattern at scale. Nepal’s hydropower fleet produces far more in the wet months than the dry ones, and the country still imports power from India to cover winter demand even as it exports surplus in the monsoon. According to Nepal Electricity Authority figures reported for fiscal year 2081/82 (mid-2024 to mid-2025), the national system had access to about 15,641 GWh of electricity across the year, with roughly 11% imported from India, most of that concentrated in the dry season (New Spotlight Magazine, citing NEA).
Now hold two of NEA’s own numbers side by side. By the end of fiscal year 2081/82, total installed capacity in the national electricity system had reached about 3,591 MW (New Spotlight Magazine, citing NEA). If every megawatt of that fleet ran flat out for the full year, it would produce well over 31,000 GWh. The system actually had access to less than half that. The gap is not waste or mismanagement. It is the plant load factor of an entire country written large, and it is exactly what happens inside a single company’s income statement too.
There is a second cruelty stacked on top. The dry season, when run-of-river plants produce least, is also when electricity is worth most, because supply is scarce. So a typical run-of-river plant makes most of its energy in the wet months when the price NEA pays is lowest, and least in the dry months when the price is highest. Plant load factor tells you the volume problem. Combined with the seasonal tariff, it tells you the plants that look biggest by megawatt can capture the lowest-value energy in bulk. That is a point we develop further in our guide to valuing a hydropower stock on NEPSE, because tariff and generation have to be read together.
The range you should expect, and why it varies so much
Not every plant has the same plant load factor, and the spread is wide enough to change a valuation completely. A study evaluating the performance of run-of-river plants operated by NEA found capacity factors mostly falling within the international best-practice band of about 50% to 80%, with one plant, Modi, coming in near the bottom at about 32%, and stronger performers well above (Performance Evaluation of Runoff River Type Hydropower Plants in Nepal, ResearchGate). That study reflects older operating data and specific plants, so treat the individual figures as illustration, not a current scorecard. The lesson is the spread. Two plants with the same nameplate can sit thirty or forty percentage points apart on plant load factor, which means one earns far more revenue per megawatt than the other from the identical headline.
What drives the difference? Three things, mostly. The river and its catchment, which set how much water arrives and how steadily. The design, particularly whether the plant has pondage, a small holding pond that lets it store a few hours of water and release it during peak demand. And plant availability, meaning how much time the plant runs without breakdown, maintenance shutdown, or being told to stop generating because the grid cannot absorb the power.
That last one matters more every year. As Nepal adds capacity faster than it adds transmission lines and domestic demand, NEA increasingly spills surplus power in the wet season, and some plants get curtailed, told to generate less than they physically could. Curtailment does not show up in the nameplate. It shows up in the plant load factor, as a real plant sitting idle while its loan payments carry on. When you read a prospectus that projects a healthy capacity factor, ask whether that projection assumes the grid will take every unit. In the current market, that assumption is getting shakier.
It helps to picture the annual shape rather than a single average. A pure run-of-river plant might run near its full rating through the monsoon, then fall to a small fraction of nameplate through the driest winter weeks. Average the two extremes and you land on a plant load factor that no single month actually looks like. This is why the annual number can flatter a plant that is close to useless for a quarter of the year, and why lenders in Nepal size their debt against the dry-season minimum, not the annual mean. A retail investor who models a smooth year of generation is modeling a plant that does not exist. The dividend has to survive the worst months, not the average ones, and the plant load factor is the first clue to how deep those worst months cut.
A real listed example: read the load factor, not the megawatts
Consider Chilime Hydropower Company, one of the better-known hydro names on NEPSE, in which NEA holds a majority stake. Its main plant is rated at 22.1 MW and was commissioned in August 2003 (Chilime Hydropower; Wikipedia). On the megawatt logic, that is a modestly sized plant, smaller than plenty of newer IPOs waving bigger numbers.
But Chilime’s main plant is a peaking run-of-river design with pondage, and it has historically run at a plant load factor around 77%, with annual generation reported near 150 GWh and deemed saleable energy to NEA of about 133 GWh (Wikipedia). That load factor figure comes from an earlier operating year and will vary, so verify the current number before relying on it. The point stands regardless. A 22.1 MW plant running near 77% produces more sellable energy, and therefore more revenue, than a 30 MW pure run-of-river plant stuck at 45% because it has no pondage and sits on a flashier, more seasonal river. The bigger megawatt number would lose that comparison on the only metric that pays a dividend.
This is the trap in one example. The market quotes megawatts. The bank that lent the money, and the accountant who books the revenue, quote units generated. Plant load factor is how you translate from the first language into the second, and the second is the one your dividend is denominated in.
How to use it before you subscribe
When the next hydropower IPO opens and the WhatsApp groups fill with megawatt figures, do this instead. Open the prospectus and find two numbers. The installed capacity in MW, which they will hand you eagerly. And the projected or design annual energy in GWh, which they will bury. If the prospectus gives you only the megawatts and no annual energy figure, that silence is itself the answer, and it is not a good one.
Then run the same one-line sum from earlier. Multiply the megawatts by 8,760 hours to get the theoretical maximum in megawatt-hours, convert to GWh, and divide the projected annual energy by it. If a 20 MW plant projects 88 GWh, its implied plant load factor is 88 divided by 175, or about 50%. If another 20 MW plant projects 105 GWh, it is running at about 60%. Same nameplate, but the second plant will generate roughly a fifth more revenue every year, forever, from the identical headline. That fifth is the entire difference between a stock that comfortably services its debt and pays you, and one that does not.
A few honest cautions on the metric itself. A higher plant load factor is not automatically better in every case, because a peaking plant that deliberately concentrates its output into high-price hours can earn more per unit even at a lower raw factor. And design energy is a projection, not a promise, so a plant can run below its projected factor in a dry year and above it in a wet one. Plant load factor is a lens, not a verdict. But it is the lens the sales pitch is built to keep you from using.
For the wider picture of how these floats are priced and sold, our explainer on how IPO allotment works in Nepal covers the subscription side, and if you want to sanity-check a company’s numbers against its reported earnings, start with the basics of how to research a NEPSE stock before you buy.
The verdict
Here is the position, stated plainly. Nepal’s hydropower market prices these companies on installed capacity because installed capacity is easy to say, easy to compare, and flattering to the promoter. It is close to useless as a measure of earnings. A megawatt of nameplate on a weak, seasonal, non-pondage run-of-river plant with a shaky offtake is not the same asset as a megawatt on a well-designed peaking plant that runs near 70%, and pretending they are equal is exactly the mistake that leaves retail investors holding a big-MW stock that never pays the dividend they modeled in their heads.
Plant load factor cuts through it. It is one ratio, it needs two numbers you can find or compute, and it tells you what the megawatt figure is desperate to hide: how much electricity actually turns into rupees. The lenders already price these projects this way. The promoters certainly know their own load factors. The only person in the transaction still counting megawatts is the retail buyer, and that is precisely why the megawatt keeps winning oversubscriptions while the load factor quietly decides who gets paid.
Count the units, not the nameplate. The river does not care what the brochure says.
This is analysis, not financial advice.