Ask most retail investors on NEPSE why they bought a bank stock and you will hear one of two answers. The dividend was good. Or the price was moving. Almost no one says the bank earns a high return on the money shareholders have put in. That last sentence is what bank ROE and ROA in Nepal actually measure, and it is the difference between owning a bank that compounds your capital and owning one that just sits on it.
Return on equity (ROE) and return on assets (ROA) are the two profitability ratios that tell you whether a bank is any good at its one job: turning capital into profit. They are not interchangeable. One can look excellent while the bank is quietly taking on more risk. The other is harder to fake. This piece explains what each number really says, why the whole sector’s ROE has fallen for eight straight years, and the trap of buying a high ROE without checking what produced it.
What ROE and ROA actually measure
Start with the plain definitions, because the two ratios answer different questions.
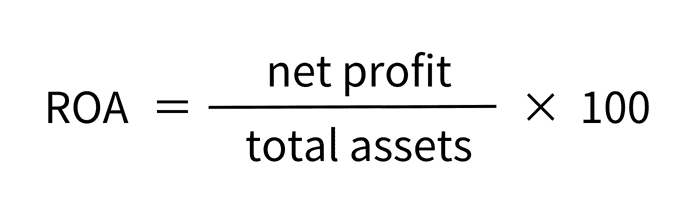
Return on assets is net profit divided by total assets, shown as a percentage. A bank’s assets are mostly its loans and investments, the money it has put to work. ROA asks: for every rupee of assets the bank controls, how much profit did it squeeze out? It is a measure of raw operating efficiency. A bank with an ROA of 1.8 percent earned NPR 1.8 of profit for every NPR 100 of assets it managed.
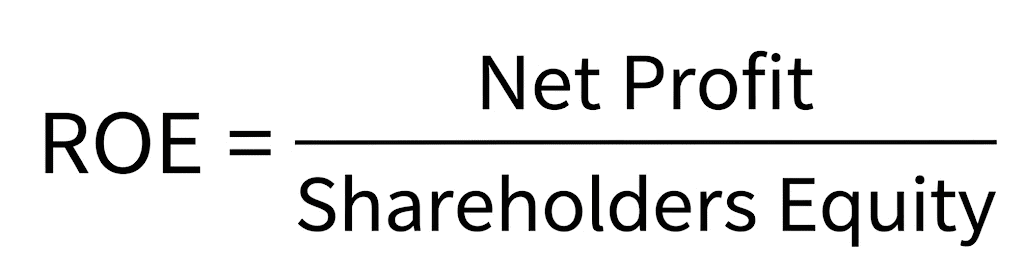
Return on equity is net profit divided by shareholder equity. Equity is the money that actually belongs to shareholders: the paid-up capital plus reserves, not the depositors’ money. ROE asks a narrower and more personal question: for every rupee that shareholders have tied up in this bank, how much profit did it generate? If you own the stock, ROE is the closest single number to your return on the business itself, before the market decides what price to slap on it.
Here is the relationship that most people miss. A bank’s ROE is its ROA multiplied by how much it has leveraged its equity. A bank funds a huge pile of assets with a thin sliver of its own capital and a large base of deposits and borrowings. That multiplier, total assets divided by equity, is leverage. So the same 1.8 percent ROA can produce a modest ROE or a large one depending purely on how leveraged the bank is. Two banks can be equally efficient and report very different ROEs. This is not a technicality. It is the single most important thing to understand before you trust a high ROE, and we come back to it below.
Why ROA is the harder number to fake
If you only have time to look at one ratio, look at ROA, then check the story ROE tells against it.
ROA is stubborn because the denominator is the whole balance sheet. A bank cannot flatter its ROA simply by changing its financing mix. To lift ROA it has to actually earn more on its assets, through a wider interest spread, more fee income, lower costs, or fewer bad loans eating into profit through provisioning. Those are real improvements in the business. In Nepal, where banks make most of their money on the gap between deposit and lending rates, ROA is tightly linked to the spread the bank runs and how clean its loan book is. We break down that spread in base rate and spread: how Nepali banks actually make money.
What does a healthy ROA look like for a Nepali commercial bank? The strongest performers run comfortably above the pack. Standard Chartered Bank Nepal reported the highest ROA among commercial banks through fiscal year 2081/82, ranging from about 1.92 to 2.42 percent across the four quarters, with an ROE around 16 percent (ShareSansar quarterly performance analyses, FY 2081/82). Most commercial banks sit well below that on ROA, often between 1 and 1.5 percent. A bank consistently earning an ROA near or above 1.5 percent is running an efficient book. One drifting below 1 percent is working its assets hard for very little profit, and no dividend headline changes that.
The reason ROA matters so much right now is the loan quality problem. When borrowers stop paying, banks must set aside provisions, and those provisions come straight out of profit, which drags ROA down first. Rising non-performing loans across the sector have squeezed profitability, a stress Nepal Rastra Bank has flagged in its Financial Stability Report. If you want the full picture of loan quality and capital, read our guide to the banking ratios NPL, CD ratio and CAR. ROA is where all of that shows up in a single line.
The leverage trap: why a high ROE can be a warning
Now the part that costs people money.
Because ROE equals ROA times leverage, a bank can boost its ROE without getting any better at banking. It just has to run a thinner equity cushion against a bigger balance sheet. More leverage, higher ROE. The number goes up and the business has not improved at all. It has simply become riskier.
This is exactly why a high ROE, taken alone, can be a red flag rather than a green light. If Bank X reports an ROE of 18 percent on an ROA of 1.2 percent, and Bank Y reports an ROE of 14 percent on an ROA of 1.7 percent, the naive reading is that Bank X is the better performer. The opposite is closer to the truth. Bank Y is genuinely more efficient at the asset level. Bank X has manufactured its higher ROE with heavier leverage, which means a thinner capital buffer and less room to absorb losses when loans go bad.
This is where ROE connects directly to capital adequacy. Nepal Rastra Bank requires commercial banks to hold a minimum capital adequacy ratio of 11 percent of risk-weighted assets under its Basel III-aligned framework. A bank chasing ROE through leverage is pushing against that floor. When bad loans rise and provisions eat into capital, a highly leveraged bank is the one that gets forced to stop paying dividends, or worse, to raise fresh capital that dilutes existing shareholders. The high ROE that attracted you becomes the reason the stock is fragile.
So the rule is simple. Never read ROE without reading ROA next to it. If ROE is high and ROA is healthy, the return is real and earned. If ROE is high but ROA is mediocre, the bank is borrowing its way to a flattering headline, and you are being paid to take on hidden balance-sheet risk. Decompose before you trust.
Why the whole sector’s ROE has fallen for years

Here is a fact that surprises people new to NEPSE. Nepali bank ROEs are structurally lower than they were a decade ago, and it is largely by regulatory design, not because banks got worse at their jobs.
In its Monetary Policy for 2015/16, Nepal Rastra Bank ordered commercial banks to raise their minimum paid-up capital from NPR 2 arba to NPR 8 arba, a fourfold increase, to be met by mid-July 2017. Banks scrambled to comply, mostly through bonus shares, rights issues and a wave of mergers. The equity base of the entire sector ballooned in barely two years.
Now recall the ROE formula. Equity is the denominator. When you quadruple the denominator but profit does not quadruple alongside it, ROE mechanically falls. And that is precisely what happened. Sector ROE dropped from around 17.71 percent in mid-July 2018 to below 9.67 percent in fiscal year 2023/24, recovering only slightly to about 10.00 percent in fiscal year 2024/25 (Nepal Rastra Bank Financial Stability Report, Issue 17). Earlier commentary put the average as high as 14.5 percent for 2017/18, already described at the time as the lowest in five years.
There are two lessons in this for an investor. First, do not compare a Nepali bank’s current ROE to its own numbers from before 2017, or to banks in markets with lighter capital rules. The goalposts moved. A 12 to 13 percent ROE for a Nepali commercial bank today is a strong result, not a weak one. Second, the capital hike is the reason ROA has become the more revealing number. The banks did not become less efficient at running assets after 2017; their profit per rupee of assets held up far better than their profit per rupee of the newly inflated equity. ROE fell because the capital base grew, and ROA kept telling the truer story about the underlying business.
This structural squeeze also explains why dividend capacity has tightened. As Nepal Rastra Bank noted, the combined distributable profit of the 20 commercial banks turned negative as of the third quarter of fiscal year 2024/25, negative by about NPR 1.67 arba (NRB data reported by The Annapurna Express). A sector earning a lower ROE on a bloated capital base, while carrying rising bad loans, simply has less to hand back.
Where to find these numbers, and how to read the trend
You do not need any paid tool. Every commercial bank publishes an unaudited quarterly financial report, and ShareSansar and Merolagani both run comparative tables of ROE and ROA every quarter. Inside a bank’s report, the figures sit in the financial highlights or key indicators section, usually labelled “Return on Equity” and “Return on Assets,” both as annualized percentages. Our walkthrough of how to read a bank’s quarterly report shows exactly where each line appears.
One caution on the annualized quarterly figure. A first-quarter ROE is annualized from three months of profit, so it can swing on a single strong or weak quarter. Do not treat one quarter’s number as the bank’s true return. Pull ROE and ROA from the last four quarterly reports and lay them side by side, the same discipline that works for every other bank ratio. A bank whose ROA is steady while ROE creeps up may be adding leverage. A bank whose ROA and ROE are both sliding is losing efficiency, usually to provisioning. The trend across quarters tells you the story that any single snapshot hides.
Watch out for one more distortion. In a year when a bank issues a large rights offering or a heavy bonus, its equity jumps mid-year, which can temporarily depress ROE even though nothing is wrong with the business. Read the number against the capital action that produced it.
The verdict: buy earned returns, not borrowed ones
If you take one thing from this, take the pairing. ROA tells you how good the bank is at banking. ROE tells you what that skill, amplified by leverage, delivers to you as a shareholder. The two must be read together, and when they disagree, ROA is usually the honest one.
The bank worth owning is the one with a solid ROA, an ROE that sits sensibly above it without relying on a dangerously thin capital cushion, and a track record of holding both steady across quarters. That is a bank compounding your capital on the strength of its actual business. The bank to be wary of is the one waving a high ROE while its ROA is ordinary and its capital ratio hugs the regulatory floor. That ROE is borrowed, not earned, and borrowed returns reverse fastest when the cycle turns.
Nepal’s capital rules have already done you a favor by squeezing out some of the easy leverage that inflates ROE in other markets. Use that. Judge a Nepali bank on how much profit it wrings from its assets first, then on how much of that reaches you, and treat any ROE you cannot explain through ROA and honest leverage as a question, not an answer.
This is analysis, not financial advice.
Frequently Asked Questions
1. What is the difference between ROE and ROA?
ROA (Return on Assets) measures how efficiently a bank generates profit from its total assets, while ROE (Return on Equity) measures how much profit it generates from shareholders’ equity. ROA focuses on the bank’s overall asset efficiency, whereas ROE reflects the return to shareholders.
2. Why is ROA important when evaluating a bank?
ROA shows how effectively a bank uses its assets to generate profit. A higher and consistent ROA generally indicates better asset-level efficiency, while a low ROA can indicate weaker profitability or issues such as higher provisions and operating costs.
3. Can a bank have a high ROE but a low ROA?
Yes. Since ROE is influenced by leverage, a bank can report a high ROE even when its ROA is relatively low. Higher leverage can amplify returns on equity without necessarily indicating better underlying operating efficiency.
4. Why have ROEs of Nepali commercial banks declined over the years?
One major reason was Nepal Rastra Bank’s increase in the minimum paid-up capital requirement for commercial banks from NPR 2 billion to NPR 8 billion. The larger equity base increased the denominator in the ROE calculation, which reduced ROE when profits did not increase proportionally.
5. How should investors read ROE and ROA together?
ROE and ROA should be examined together rather than relying on either ratio alone. ROA helps assess asset-level efficiency, while ROE shows the return generated on shareholders’ equity. Looking at both over several quarters can provide a clearer picture of a bank’s profitability and the role of leverage.